  Girth Height Volume
1   8.3     70   10.3
2   8.6     65   10.3
3   8.8     63   10.2
4  10.5     72   16.4
5  10.7     81   18.8
6 10.8 83 19.7Rで標準化する
R
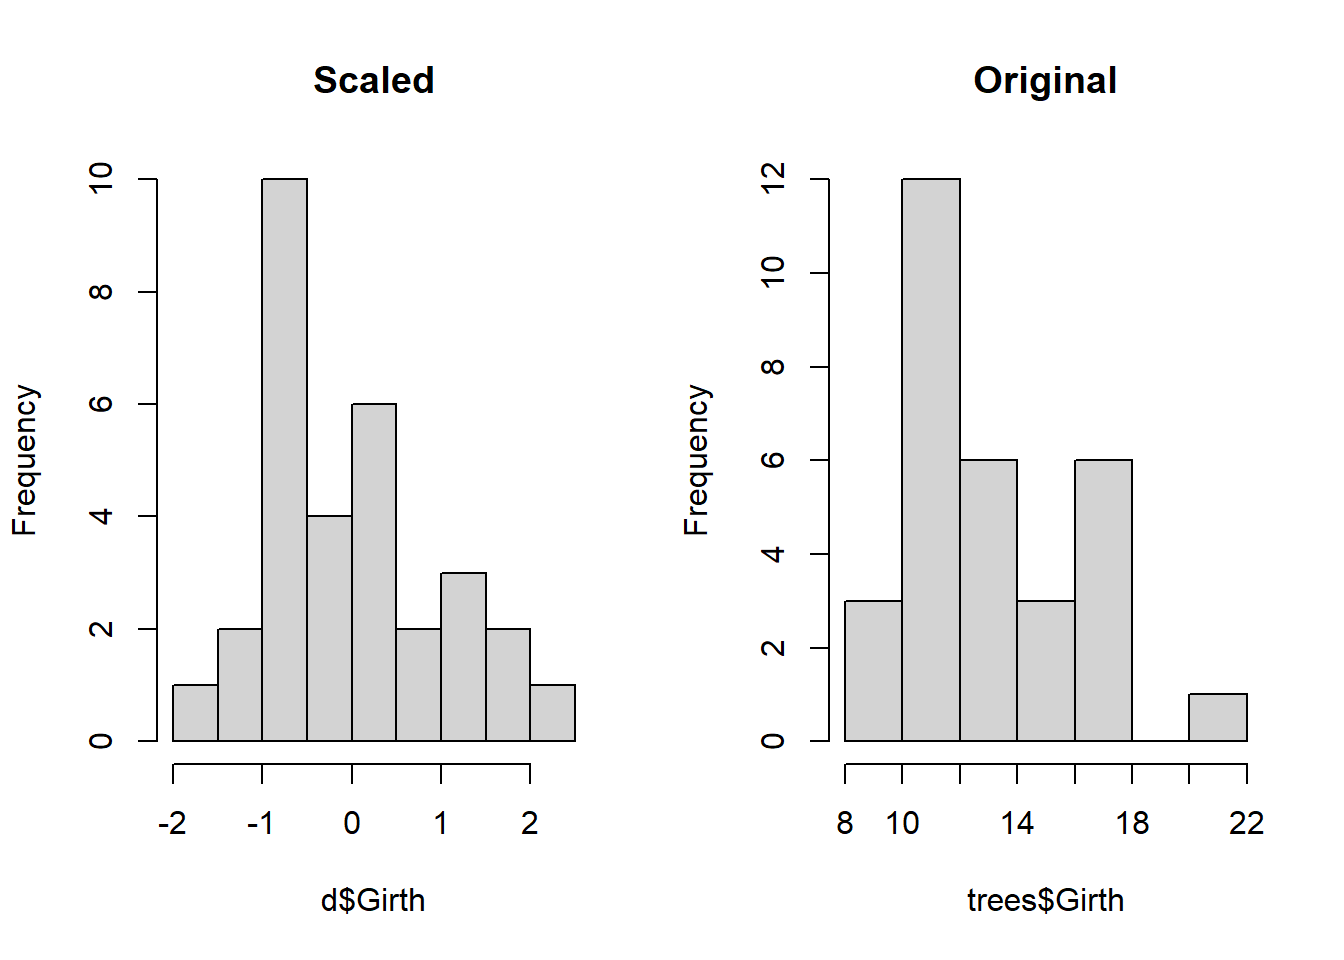
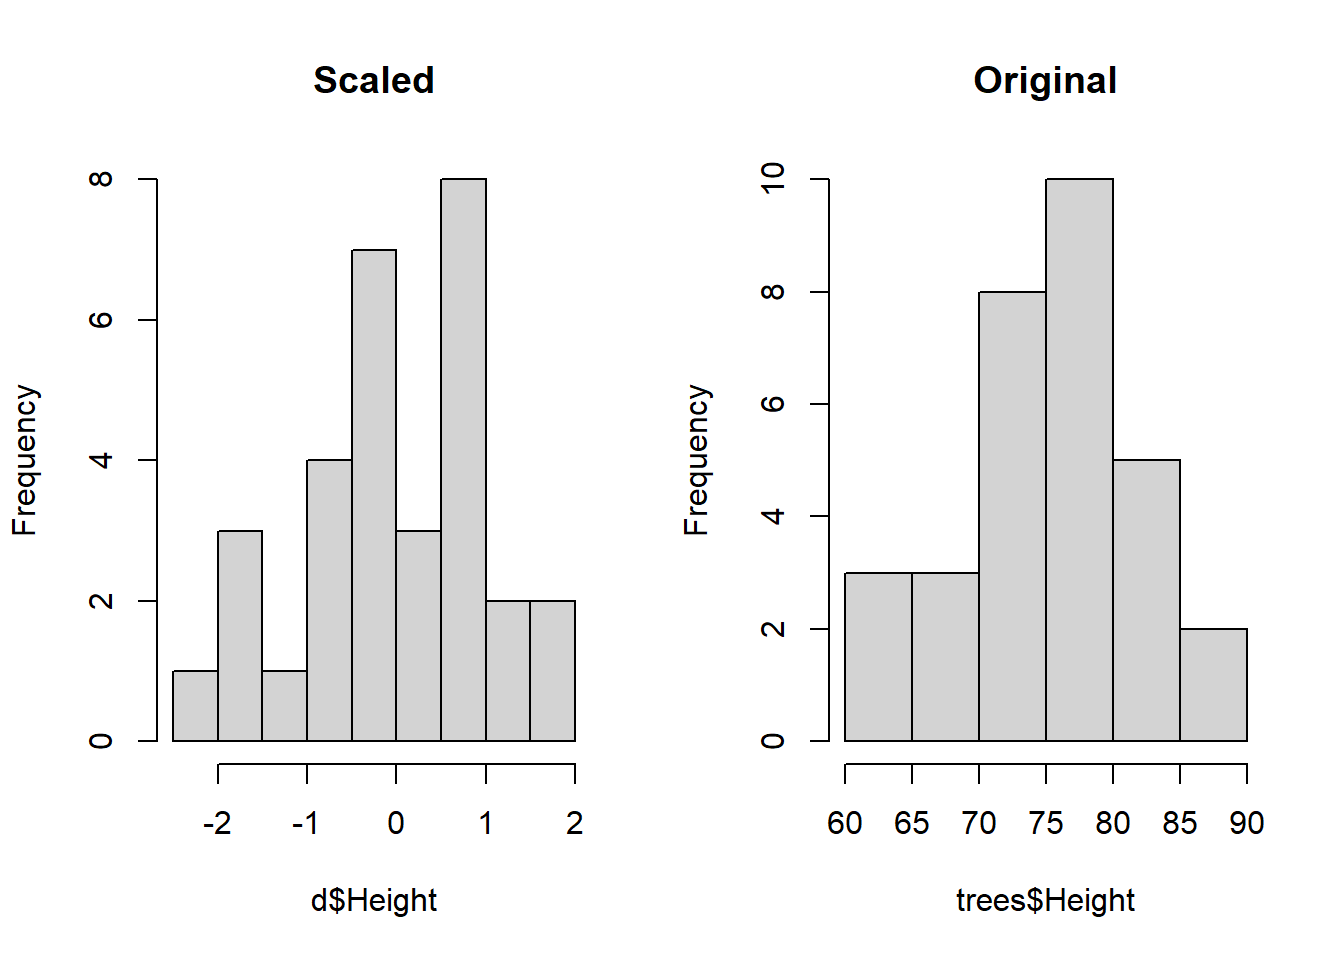
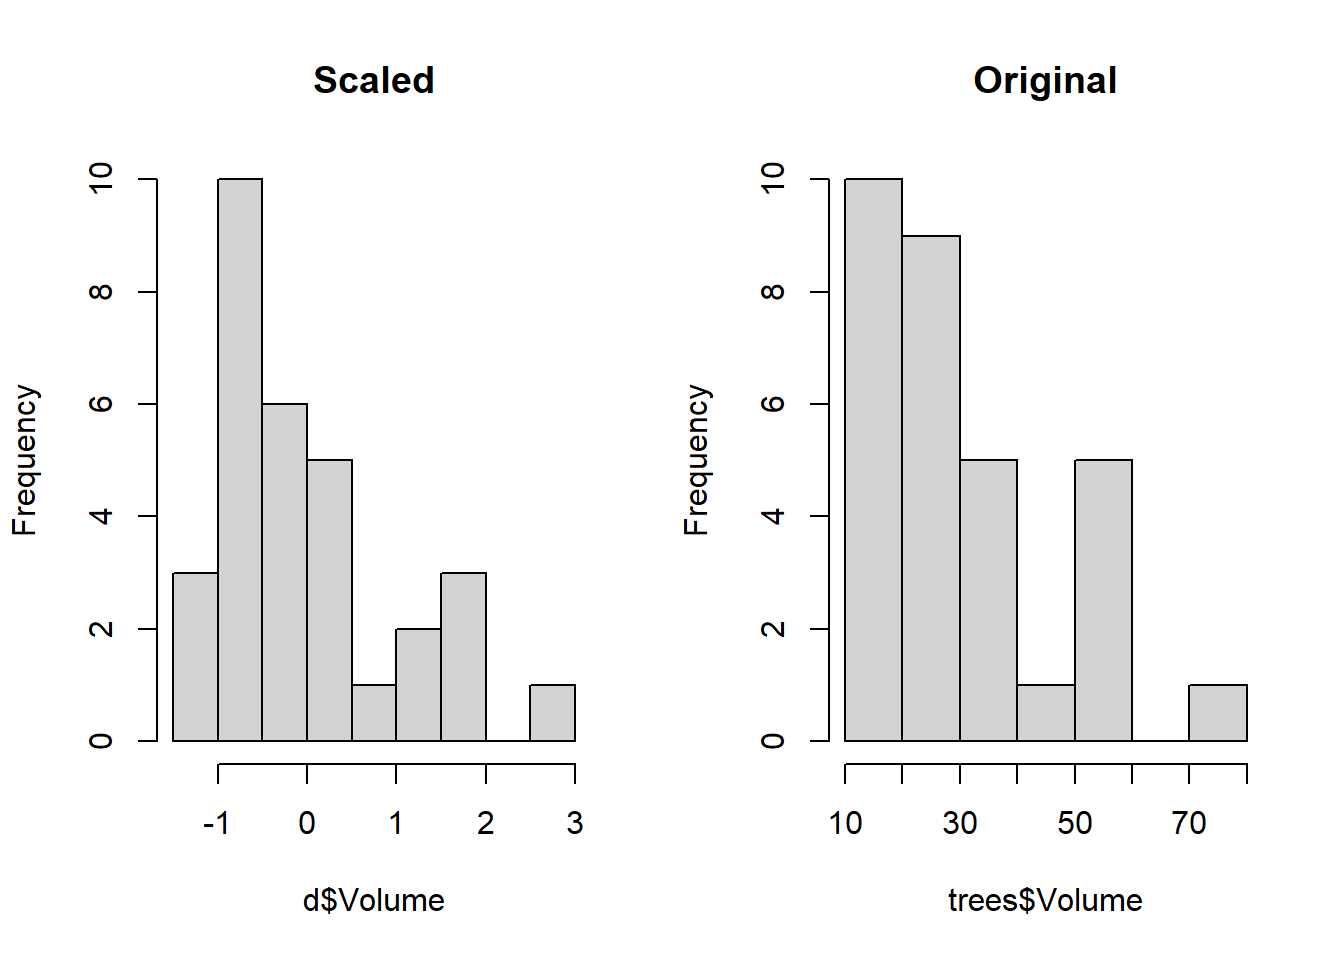
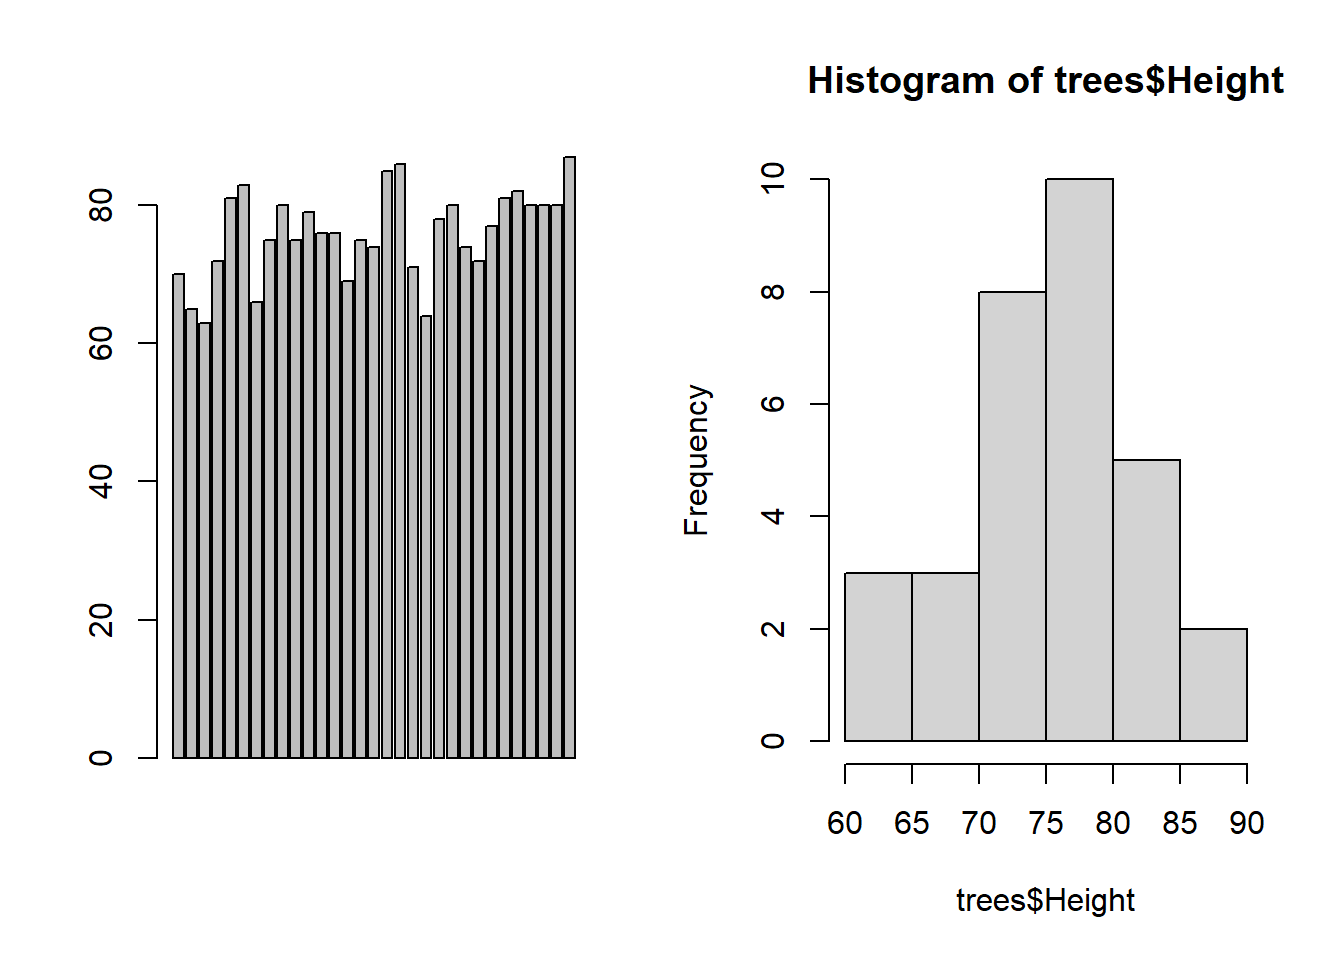
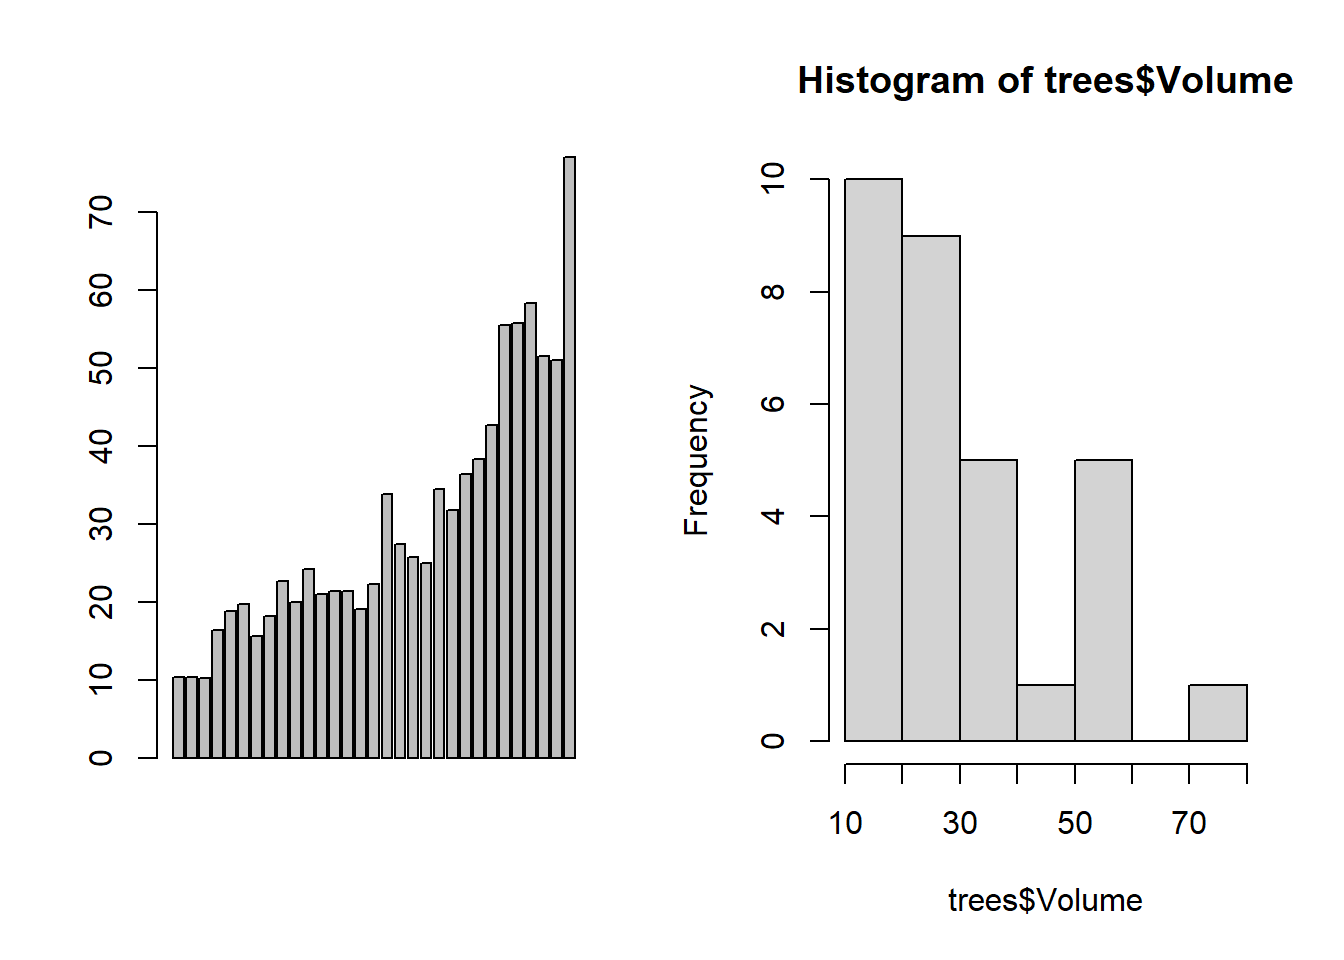
Rで標準化をおこなうにはscale関数を使用します。 今回は例としてtreesというデータセットを使用します。 これは、伐採された31本のブラックチェリーという木の周囲長Girth(インチ)、樹高Height(フィート)、材積Volume(フィート)が記録されています。
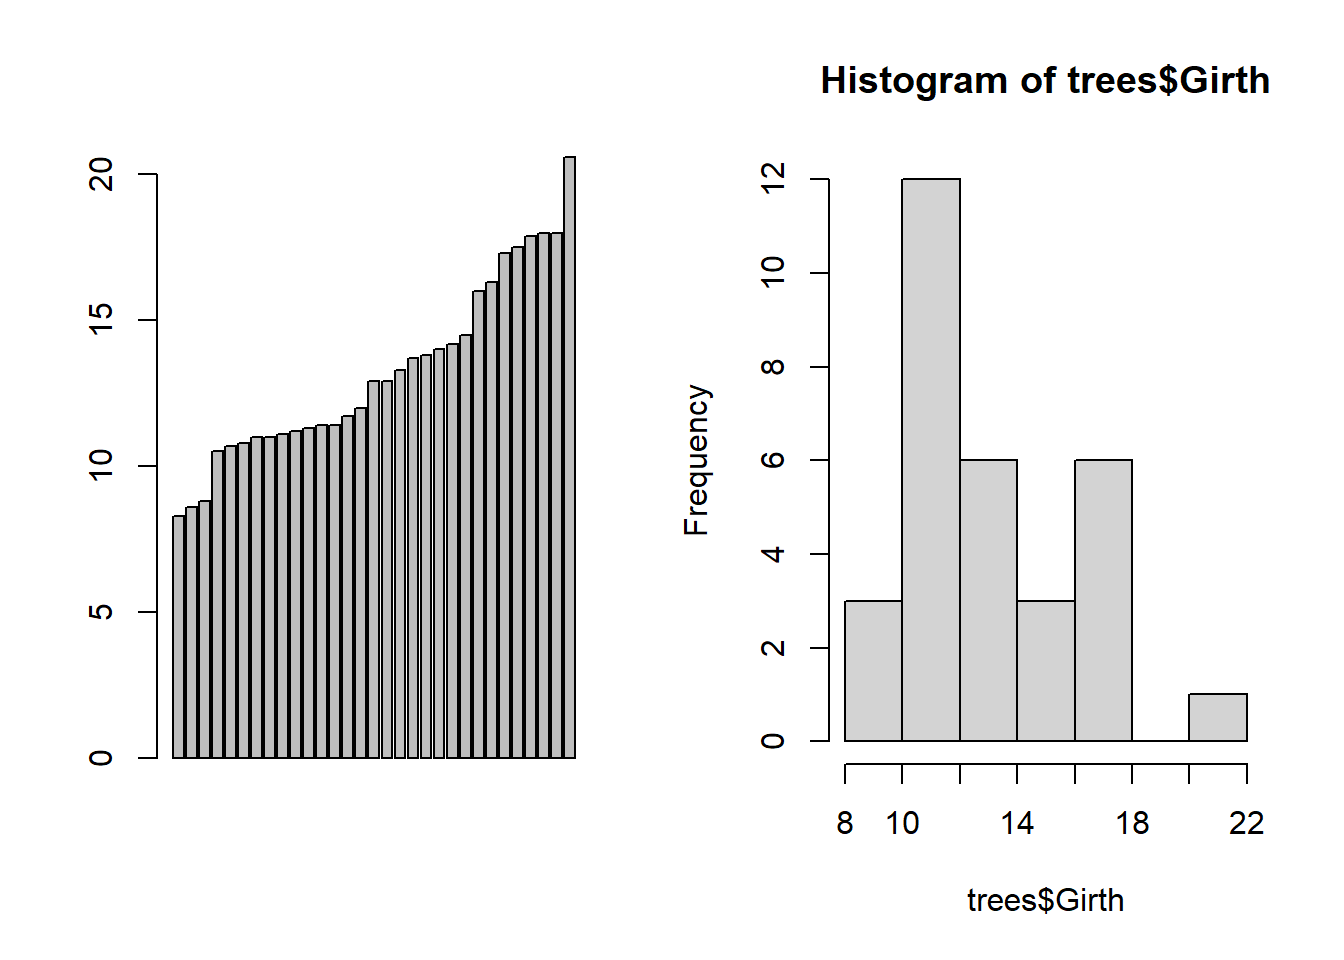
簡単に棒グラフとヒストグラムでデータを見てみましょう。
d <- apply(trees, 2, scale)
d <- as.data.frame(d)

layout(matrix(c(1, 2), ncol = 2))

hist(d$Girth, main = "Scaled")
hist(trees$Girth, main = "Original")